UMSI students bring accurate COVID-19 data to Michigan citizens
Wednesday, 03/24/2021
Four UMSI seniors on the information analysis pathway are undertaking an ambitious project to help empower Michigan citizens through access to accurate COVID-19 data.
A year after the deadly strain of coronavirus entered the State of Michigan, policy and health experts have had to scale mountains of accumulating statistics. Data is being reported by the state and collected by third-party sources ranging from hospitals to media organizations. For everyday citizens, making sense of this deluge of information and understanding the discrepancies between each source can be overwhelming.
Kavya Pratapa, Lucas Benson, Zini Brace and Kelly Kacan are spending their final semesters at UMSI partnering with Data Driven Detroit (D3). The Detroit-based nonprofit is on a mission to “collect, analyze, interpret, and share high-quality data to drive informed decision making and increase data-driven outcomes,” according to their website.
The senior group is working with D3 as part of SI 485 where they complete a capstone project, an academic and professional experience during which UMSI students partner with clients to provide real-world solutions to workplace challenges. Zini said, “It’s a great opportunity that the school gave us to work with a company directly in the field. They’re doing influential work.”
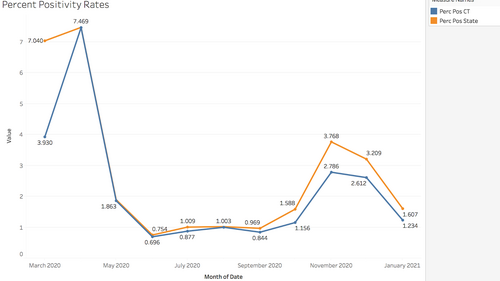
In this case, the work is minimizing disinformation related to COVID-19. D3 is currently combining data sets collected by Johns Hopkins, the New York Times and the COVID Tracking Project to create a dashboard that Michigan residents can consult.
The seniors noted of their project: “Based upon how these third-party data sources are collected and calculated, there is a possibility of over/under-reporting, which could potentially mislead current users that rely on D3’s COVID-19 portal for the most up-to-date Coronavirus information.”
The main goals of the partnership are comparing and analyzing disparities across data sets, classifying issues of inconsistent reporting, producing visualizations that illustrate these discrepancies and reporting their findings to leadership of D3 who can update their COVID-19 map to reflect these discrepancies for users of their dashboard.
Kavya said she was drawn to the project because of the opportunity to help Michiganders: “As the pandemic began, a lot of people relied on the media for the reporting and keeping track of the situation to make decisions. I felt that being able to work a on a project where we could provide more accurate data for people would be really helpful, especially as people are starting to make decisions about what their lifestyle is going to look like given that the pandemic is still very much a part of society and a part of today’s culture.”
Kelly noted that, in addition to adapting to a remote work environment, one of the teams’ greatest challenges has been the need to go back and confirm older data that the state has reported and the group has input. “It’s hard for third party sources to keep up with what the state's doing because they're not reporting that they're going back and changing statistics. They're doing it without noting it on their website,” she said.
The UMSI team has been reflecting on the community-centered nature of their project. They shared that one of the greatest resources for keeping their mission at the center of the work has been their UMSI colleagues in SI 485. Zini shared: “During class time we learn from the other groups. Their struggles help teach us and then we can offer help or learn from their mistakes.”
He continued, “It’s a group learning experience for all of us.”
By the end of the spring, the team will have produced a final report that allows D3 to gain an understanding of the errors and discrepancies in the data they are currently using. This will enable them to inform their clients of the possible misinformation, create a new application to inform the Detroit community on the best sources for coronavirus data, as well as present the most accurate and reliable coronavirus map on their website.
- Kate Cammell, UMSI News